Gas vs. electric driving costs · adjust vehicle and price period below
Why is it like this in Florida?
Florida's residential electricity rates of about 15.8¢/kWh sit slightly below the national average, supported by a mix of natural-gas generation and growing utility-scale solar. Gasoline is roughly at the national average. Electric wins on per-mile cost — a comfortable margin that reflects Florida's relatively moderate electricity pricing and absence of the extreme rate spikes seen in New England.
In the news · Florida

The DeSantis-appointed PSC approved a four-year FPL settlement worth roughly $6.9B, with base-rate increases of $945M in 2026 and $705M in 2027 and a 10.95% authorized ROE — the direct mechanism that will push FL's per-mile electric cost closer to its gasoline cost over the next four years.

The state Office of Public Counsel and Florida Rising offered a counter-proposal cutting FPL's base ask roughly in half (about $5.2B); the PSC rejected it. Consumer groups have signaled a Florida Supreme Court challenge — meaningful upside risk on FL's electricity-rate input through 2029.

Tampa Electric and Duke Energy Florida both raised residential rates in March 2025 under multiyear rate agreements permitting ~2% average annual growth — compounding the FPL hike to make Florida's electricity trajectory a growing concern for PHEV electric-mode savings.
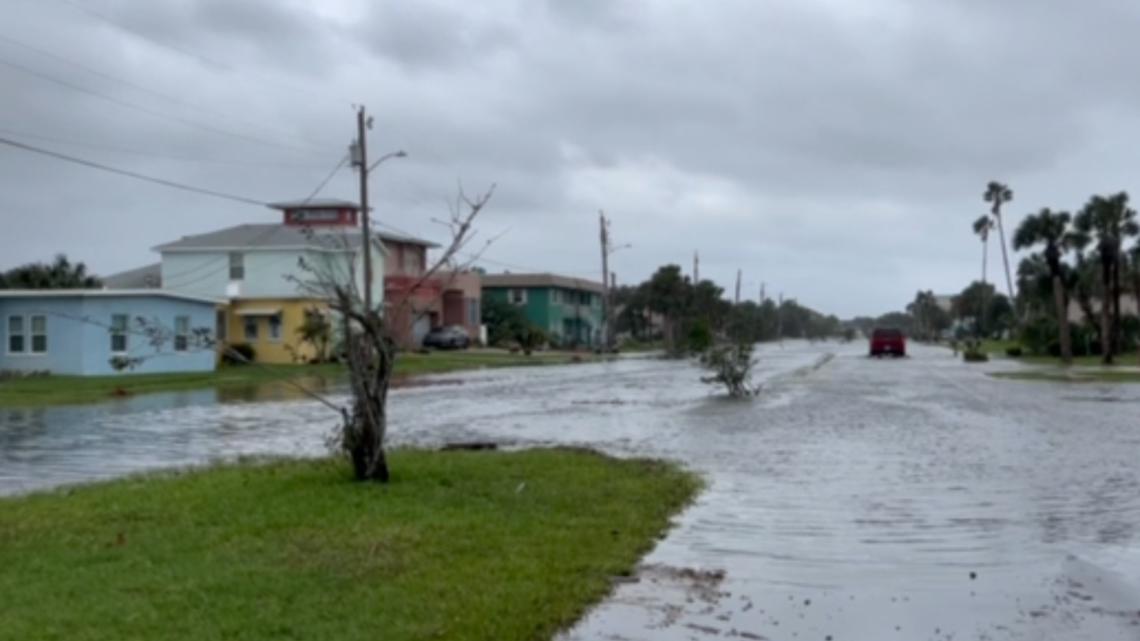
The PSC let FPL recoup $1.2B in 2024 hurricane costs via a $12.02/month surcharge through 2025 ($811M from Milton alone). Duke Energy Florida added roughly $21/month for the same hurricanes through Feb 2026 — storm-recovery passthrough is becoming a structural rate driver in Florida separate from base rates.

Tesla is planning a 200-stall Supercharger at Turnpike exit 193 in Osceola County, alongside expansion at the eight Turnpike service plazas where FPL and Duke are also installing chargers. Backbone fast-charging is the precondition for FL drivers to actually capture the electric-mode cost advantage.
Curated coverage of Florida's EV/PHEV cost, policy, and infrastructure story. External links open in a new tab.
Southeast region comparison
| State | Electric ¢/mi | Gas ¢/mi | Cheaper | Annual diff |
|---|---|---|---|---|
| West Virginia | 4.5¢ | 7.5¢ | ⚡ Electric | $363/yr |
| North Carolina | 4.1¢ | 7.0¢ | ⚡ Electric | $346/yr |
| Arkansas | 3.7¢ | 6.4¢ | ⚡ Electric | $319/yr |
| Louisiana | 3.8¢ | 6.4¢ | ⚡ Electric | $313/yr |
| Tennessee | 4.0¢ | 6.6¢ | ⚡ Electric | $310/yr |
| Georgia | 4.4¢ | 6.9¢ | ⚡ Electric | $307/yr |
| Florida | 4.8¢ | 7.3¢ | ⚡ Electric | $295/yr |
| Kentucky | 4.3¢ | 6.8¢ | ⚡ Electric | $295/yr |
| Virginia | 4.8¢ | 7.3¢ | ⚡ Electric | $294/yr |
| Mississippi | 4.3¢ | 6.4¢ | ⚡ Electric | $247/yr |
| South Carolina | 4.7¢ | 6.6¢ | ⚡ Electric | $230/yr |
| Alabama | 4.9¢ | 6.5¢ | ⚡ Electric | $201/yr |