Gas vs. electric driving costs · adjust vehicle and price period below
Why is it like this in California?
California's residential electricity rates — about 33.8¢/kWh statewide and substantially higher in PG&E and SCE territories — reflect wildfire-related grid hardening costs, transmission upgrades, and the state's clean-energy procurement programs, all passed through to ratepayers. Gasoline is also expensive at $5.95/gal, the highest in the country, due to California's unique fuel-blend requirements and refining capacity constraints. Electric still wins on per-mile cost, but the margin is narrower than in most of the country.
In the news · California

The October 2025 fire at Chevron's El Segundo plant — California's second-largest refinery — hit as Phillips 66's LA refinery wound down and Valero's Benicia plant was scheduled to close in April 2026, together knocking out roughly 17% of in-state refining and locking in structural upside risk on California pump prices.
Valero's planned April 2026 shutdown of its Benicia refinery — about 9% of California's gasoline supply — shifts Northern California toward imports under CARB-spec fuel rules, structural pressure on pump prices that outlasts any conflict-driven spike.
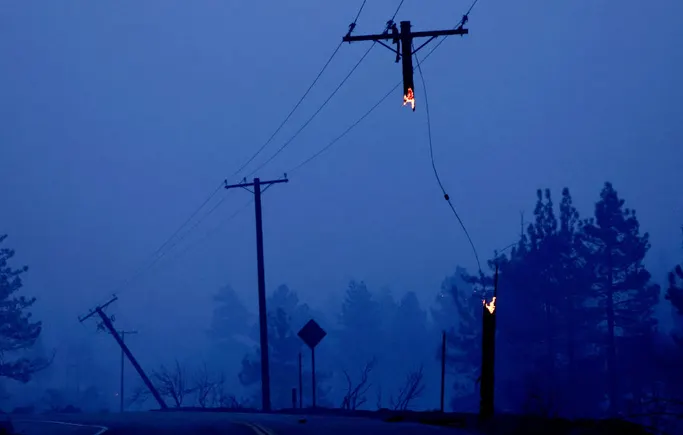
The CPUC voted 4-1 to trim allowed ROE for PG&E, SCE, SoCalGas, and SDG&E by 0.3 points (PG&E lands at 9.98%). The move saves ratepayers around $100M but barely dents bills because wildfire-related costs still account for nearly 30% of PG&E's revenue requirement — the structural driver keeping California residential rates near 34¢/kWh.

Newsom signed SB 254 and a companion package projected to save ratepayers around $10B by substituting public financing for utility-rate-base spending on wildfire hardening and transmission — Sacramento's most concrete attempt yet to bend the curve on residential rates that are now roughly double the U.S. average.

After Trump signed CRA resolutions revoking California's Advanced Clean Cars II waiver, AG Bonta filed suit and Newsom directed CARB to write a new mandate. The fight is central to whether California's EV-share trajectory — and the demand assumptions behind CPUC charging-rate design — materializes.
Curated coverage of California's EV/PHEV cost, policy, and infrastructure story. External links open in a new tab.
West region comparison
| State | Electric ¢/mi | Gas ¢/mi | Cheaper | Annual diff |
|---|---|---|---|---|
| Washington | 4.2¢ | 10.0¢ | ⚡ Electric | $701/yr |
| Nevada | 4.2¢ | 8.8¢ | ⚡ Electric | $549/yr |
| Oregon | 4.4¢ | 8.8¢ | ⚡ Electric | $519/yr |
| Idaho | 3.7¢ | 7.3¢ | ⚡ Electric | $432/yr |
| Montana | 3.9¢ | 7.2¢ | ⚡ Electric | $398/yr |
| Utah | 3.9¢ | 6.8¢ | ⚡ Electric | $342/yr |
| Wyoming | 3.9¢ | 6.5¢ | ⚡ Electric | $307/yr |
| California | 9.2¢ | 11.1¢ | ⚡ Electric | $228/yr |
| Colorado | 5.0¢ | 6.6¢ | ⚡ Electric | $196/yr |
| Alaska | 7.7¢ | 9.1¢ | ⚡ Electric | $170/yr |
| Hawaii | 12.1¢ | 11.6¢ | ⛽ Gas | $59/yr |